The intricate landscape of social media and online services is continually transforming, with the engagement patterns of the Israeli populace offering compelling insights. At the Israel Internet Association (ISOC-IL), we present an extensive data-driven narrative on this theme, rooted in findings from the first quarter of 2023. Our analysis, segmented by usage frequency and age groups, is grounded on a survey conducted in January 2023 by the Maagar Mochot Research Institute, under the guidance of Professor Yitzhak Katz. This study, with a representative sample of 1,040 respondents from across the diverse Israeli society, seeks to understand the evolving relationship between Israelis and the digital realm.
The following dashboard allows you to explore the data and focus on various demographics:
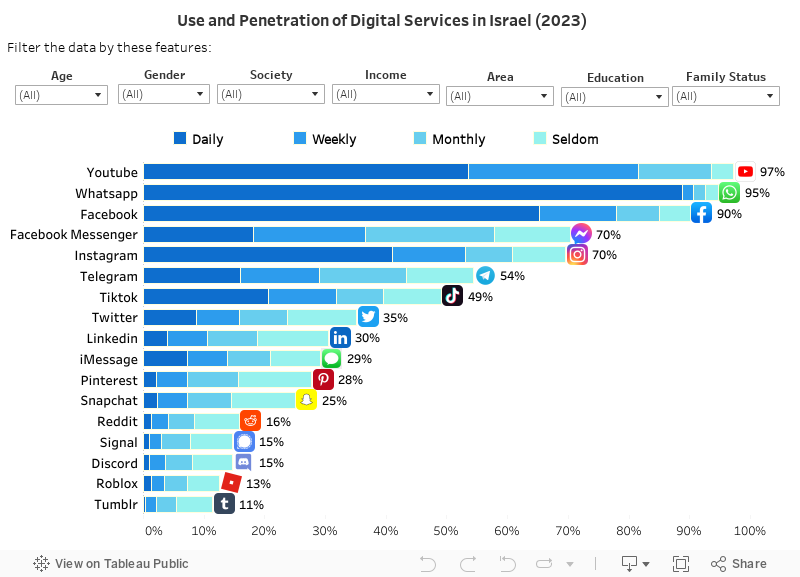
We found some noticeable differences in the everyday use of social networks among different population groups:
- Geographically, in the North, TikTok usage stands out, with 32% using it daily compared to 9-24% in other areas. In the Jerusalem District, YouTube use is prominent, with 70% using it daily as opposed to 49-59% in other areas.
- Arab population has a higher percentage of daily TikTok users (32% of them) compared to Jews (only 9% among the ultra-Orthodox, and 16-22% among secular, traditional and religious Jews).Daily usage of Telegram, however, is more prevalent among religious and ultra-Orthodox Jews (23-26% of them, as opposed to 12-16% among other groups).
- Single individuals tend to use YouTube and Instagram more frequently (59% of them) compared to 50-51% of the married, divorced, separated, widowed, or single parents. Likewise, daily Instagram use is preferred by single individuals (57% of them) compared to divorced, separated, widowed, and single parents of whom only 27% use it daily (and among the married: 35%). Conversely, divorced, separated, widowed, and single parents use Facebook more often (74% of them) compared to singles and married individuals (63-66% of them).
- Gender perspective: 13% of men use Twitter daily versus 5% of women; 24% of men use Telegram daily versus approximately 9% of women; 69% of women use Facebook daily versus 60% of men; and 49% of women use Instagram daily versus 32% of men.
- Daily TikTok and Instagram decreases with education level (28% of high school-educated individuals use it daily, compared to 20% of those with post-high school education and 16% of those with a college degree).Furthermore, 48% of those with a high school education use Instagram daily – significantly more than among those with post-high school education (32% of them) or academics (41% of them).
- Twitter usage is more common among individuals with much higher than average household income (26% of them use Twitter daily, versus only 4-10% among those with lower incomes).
Usage by Age-Groups
Data suggests an intriguing trend regarding daily usage of popular social media platforms across various age groups:
Instagram usage decreases with age. It’s daily used by:
- 66% of 18-24-year-olds
- 59% of 25-30-year-olds
- 15% of individuals aged 65 and up
TikTok is popular among younger users:
- – 35% of 18-24-year-olds use it daily
- – Usage drops to 8% for individuals aged 65 and up
Facebook usage varies by age, with a strong presence in the middle age groups:
- Daily usage is 55% among 18-24-year-olds
- It’s highest among 40-49-year-olds, with 77% daily usage
- It drops to 52% for those aged 65 and up
YouTube usage is highest in the 31-39-year-old group:
- 68% of 31-39-year-olds use it daily
- It drops to 35-40% for individuals aged 50 and up
- The platform is used daily by 56-58% of other age groups